Take Home Messages
- This coordinated study was conducted in 16 states at 46 sites.
- The tested prophylactic foliar fertilizers did not increase soybean yield.
- Foliar fertilizers did not change grain protein and oil concentration.
- Some tested prophylactic foliar fertilizers decreased profitability, and no tested products increased profitability.
Foliar Fertilizer Overview
There is interest among farmers and agronomists to test different fertilizer products to improve soybean yield. With increasing soybean yields across the U.S., there are concerns that fields with higher yields may need supplemental fertilizer. Soybean farmers are interested in foliar products that apply a mixture of micronutrients and macronutrients and can be tank-mixed with insecticides and fungicides and applied during early reproductive growth (R1-R4). This timeline corresponds with a period of high nutrient uptake for soybean (Gaspar et al., 2017).
Foliar fertilizers enter the plant through the leaves, first passing through the waxy cuticle, then the cell wall, and finally the cell membrane. Foliar fertilizers enter leaves more quickly when stomata are open, since stomata aid passage past the waxy cuticle (Fageria et al., 2009). Macronutrients are more mobile than micronutrients in plant tissues, with the exceptions of Ca and S (Fageria et al., 2009). For immobile nutrients, foliar fertilization may help distribute essential nutrients to deficient plant parts.
Past Foliar-applied Macronutrient Trials
Past foliar fertilizer research has shown inconsistent impacts on soybean yield, with soybean yield increases associated with N-P-K-S application of up to 8 bu/A observed in Iowa in the 1970s (Garcia L. & Hanway, 1976) despite a contemporaneous study in Wisconsin showing much smaller yield increases associated only with N application (Syverud et al., 1980). In a Minnesota study, the yield benefit to N-P-K-S foliar fertilization was only observed in one out of 16 trial site-years, and no yield benefit to micronutrient application (Poole et al., 1983).
Larger studies in the 1990s in Iowa showed small, inconsistent increases in yield with early-season prophylactic foliar fertilizer application, including yield increases in plots treated with N-P-K of less than 1 bu/A at 10 out of 48 site-years (Haq & Mallarino, 1998). In a subsequent on-farm strip trial testing N-P-K fertilization, there was a 0.5 bu/A increase in soybean yield at one out of eight sites (Mallarino et al., 2001). The associated small-plot trial tested a wider range of nutrient rates and had two responsive locations out of 18 with a 1.4 to 5.3 bu/A increase in soybean yield when N, P, and K were applied (Mallarino et al., 2001).
Agronomists in Michigan have performed extensive foliar fertilizer trials in soybean since 2000. Out of the 51 location N-P-K product trials, four locations had increased yield in fertilized plots. Three of 18 locations in Michigan had higher yield in N-treated plots than control plots (Staton, 2019).
Past Foliar-Applied Micronutrient Trials
Prophylactic application of micronutrients has shown similarly minimal effects on soybean yield. Between the 1980s and today, trials in Iowa, Minnesota, and Michigan have not shown a yield increase in soybean associated with Fe, Zn, B, Co, Cu, Zn, Mn, or Mo foliar prophylactic application (Mallarino et al., 2001; Poole et al., 1983). Rare response to micronutrients has been observed in Ohio, where less than 2% of Mn trials have seen an increase in yield when fertilizer was applied and less than 5% of trials treated with a mixture of Mn, Fe, Cu, Mo, and B fertilizers had an observed soybean yield increase (Sharma et al., 2018). In Michigan fields with high pH lakebed soils that are likely to respond to Mn application, foliar Mn application only increased yield when it was applied after visual symptoms of nutrient deficiency began, but not when Mn was applied prophylactically (Staton, 2019).
Trial Objectives
Past foliar fertilizer research indicates that yield increases are infrequent. This study was a coordinated effort across 16 states to test the effects of macronutrient and micronutrient foliar fertilization across the primary soybean producing region of the U.S. and includes a broad range of commercially available foliar fertilizer products. The objectives of this study were to:
- Identify soybean grain yield response to prophylactic foliar fertilizer application across a broad range of environments.
- Determine if foliar fertilizer application changes soybean grain composition.
- Conduct economic analyses on the value of these products in U.S. soybean production.
Tested Products
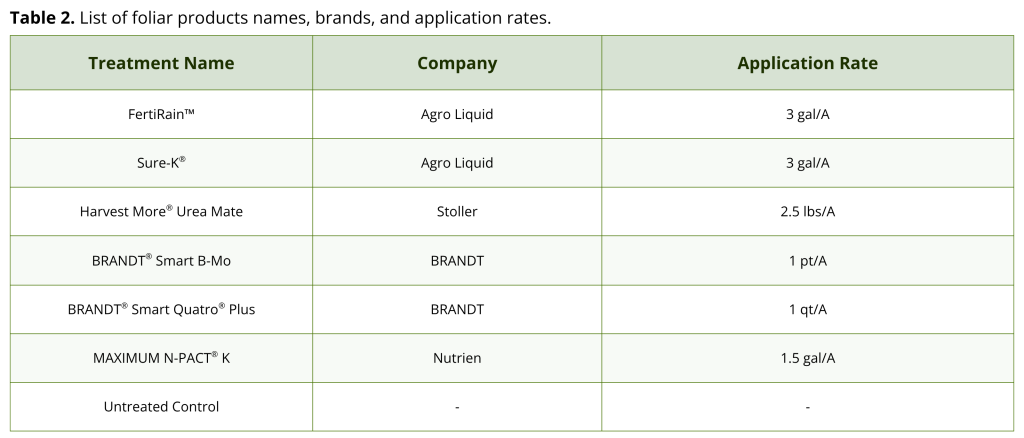
Foliar fertilizer products vary based on the nutrients they contain and their relative concentrations, the formulation of the product, the recommended product rate, and other application recommendations. In this trial, we selected six commercially available foliar nutrient products that are marketed nationwide for soybean production. These products included different nutrients at different rates (Table 1).

Each product label included different application instructions, including recommended rates and application timings. We applied all treatments at the R3 soybean growth stage (beginning pod) and used an application rate within the range specified on each product label (Table 2.)
Trial Methods
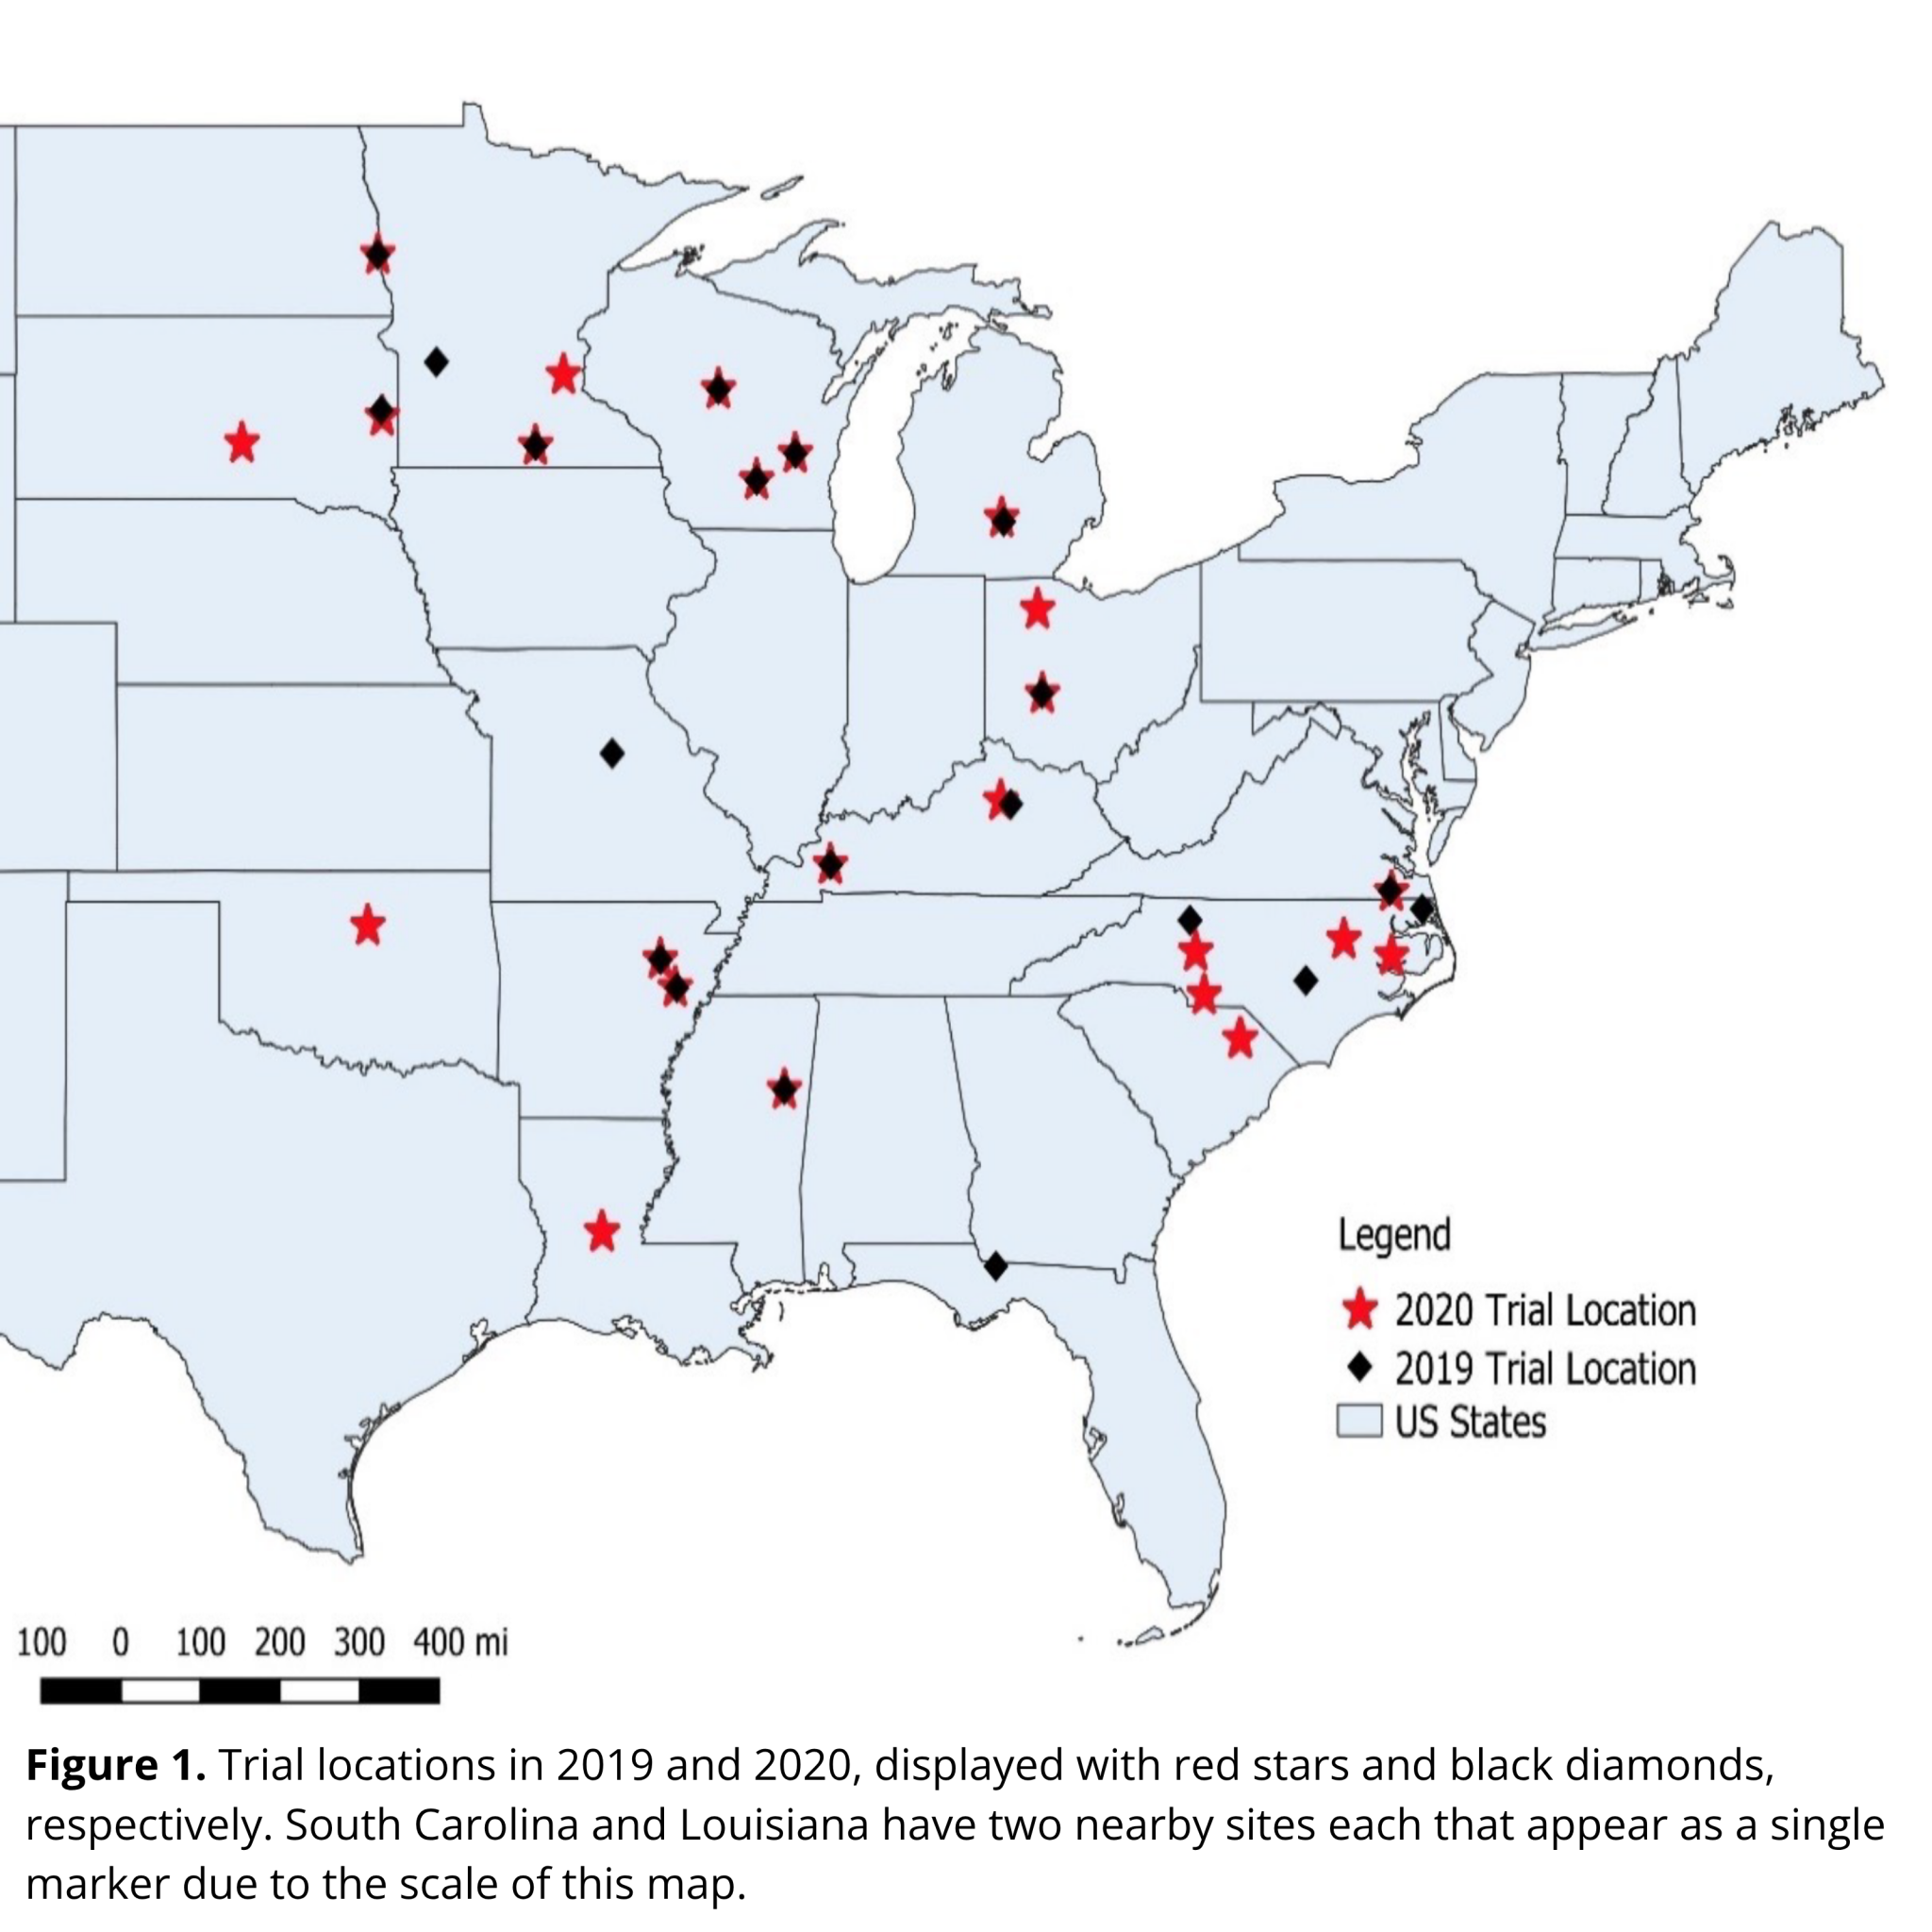
Small-plot field trials took place in 2019 and 2020 at a total of 46 sites in 16 states (Figure 1). The six foliar nutrient products (Table 2) and an untreated control were applied in a randomized complete block design with four to eight replications depending on site. Products were applied at soybean growth stage R3 to align with commonly used fungicide and insecticide application timing. Site soil properties and management practice are summarized in Supplemental Table 1 (view Supplemental Tables in factsheet).
Products were applied to plots using backpack sprayers at the R3 growth stage. Leaf tissue samples were taken before foliar products were applied at R3 and two weeks following application. At both sampling time points, the newest fully expanded trifoliate leaf was collected from 20 plants per plot and dried in paper bags before being shipped to the North Carolina Dept. of Agriculture & Consumer Services Agronomic Division (Raleigh, North Carolina) for analysis.
Yield data were collected using plot combines at each site and adjusted to 13% moisture. Grain protein and oil concentrations were measured via near-infrared spectroscopy (NIR) and reported at a standard moisture of 13%.
Analysis Methods
Cost of foliar fertilizer products were assessed by calling retailers in the study region in 2019 and averaging the cost of product per acre at the application rate used in the study (Table 2). Partial profits were calculated by multiplying yield by the price of soybean grain and subtracting the cost of the foliar fertilizer product. Application costs were not considered since these products are frequently applied by farmers as part of a tank-mix with foliar fungicides and insecticides. Calculations were performed at $10 and $15 per bushel to be reflective of recent soybean prices.
Change in tissue nutrient concentration was calculated by subtracting nutrient concentration from the preapplication samples from the nutrient concentration from the two-week post-application samples. Details on the statistical analysis used can be found in the scientific publication.
Results
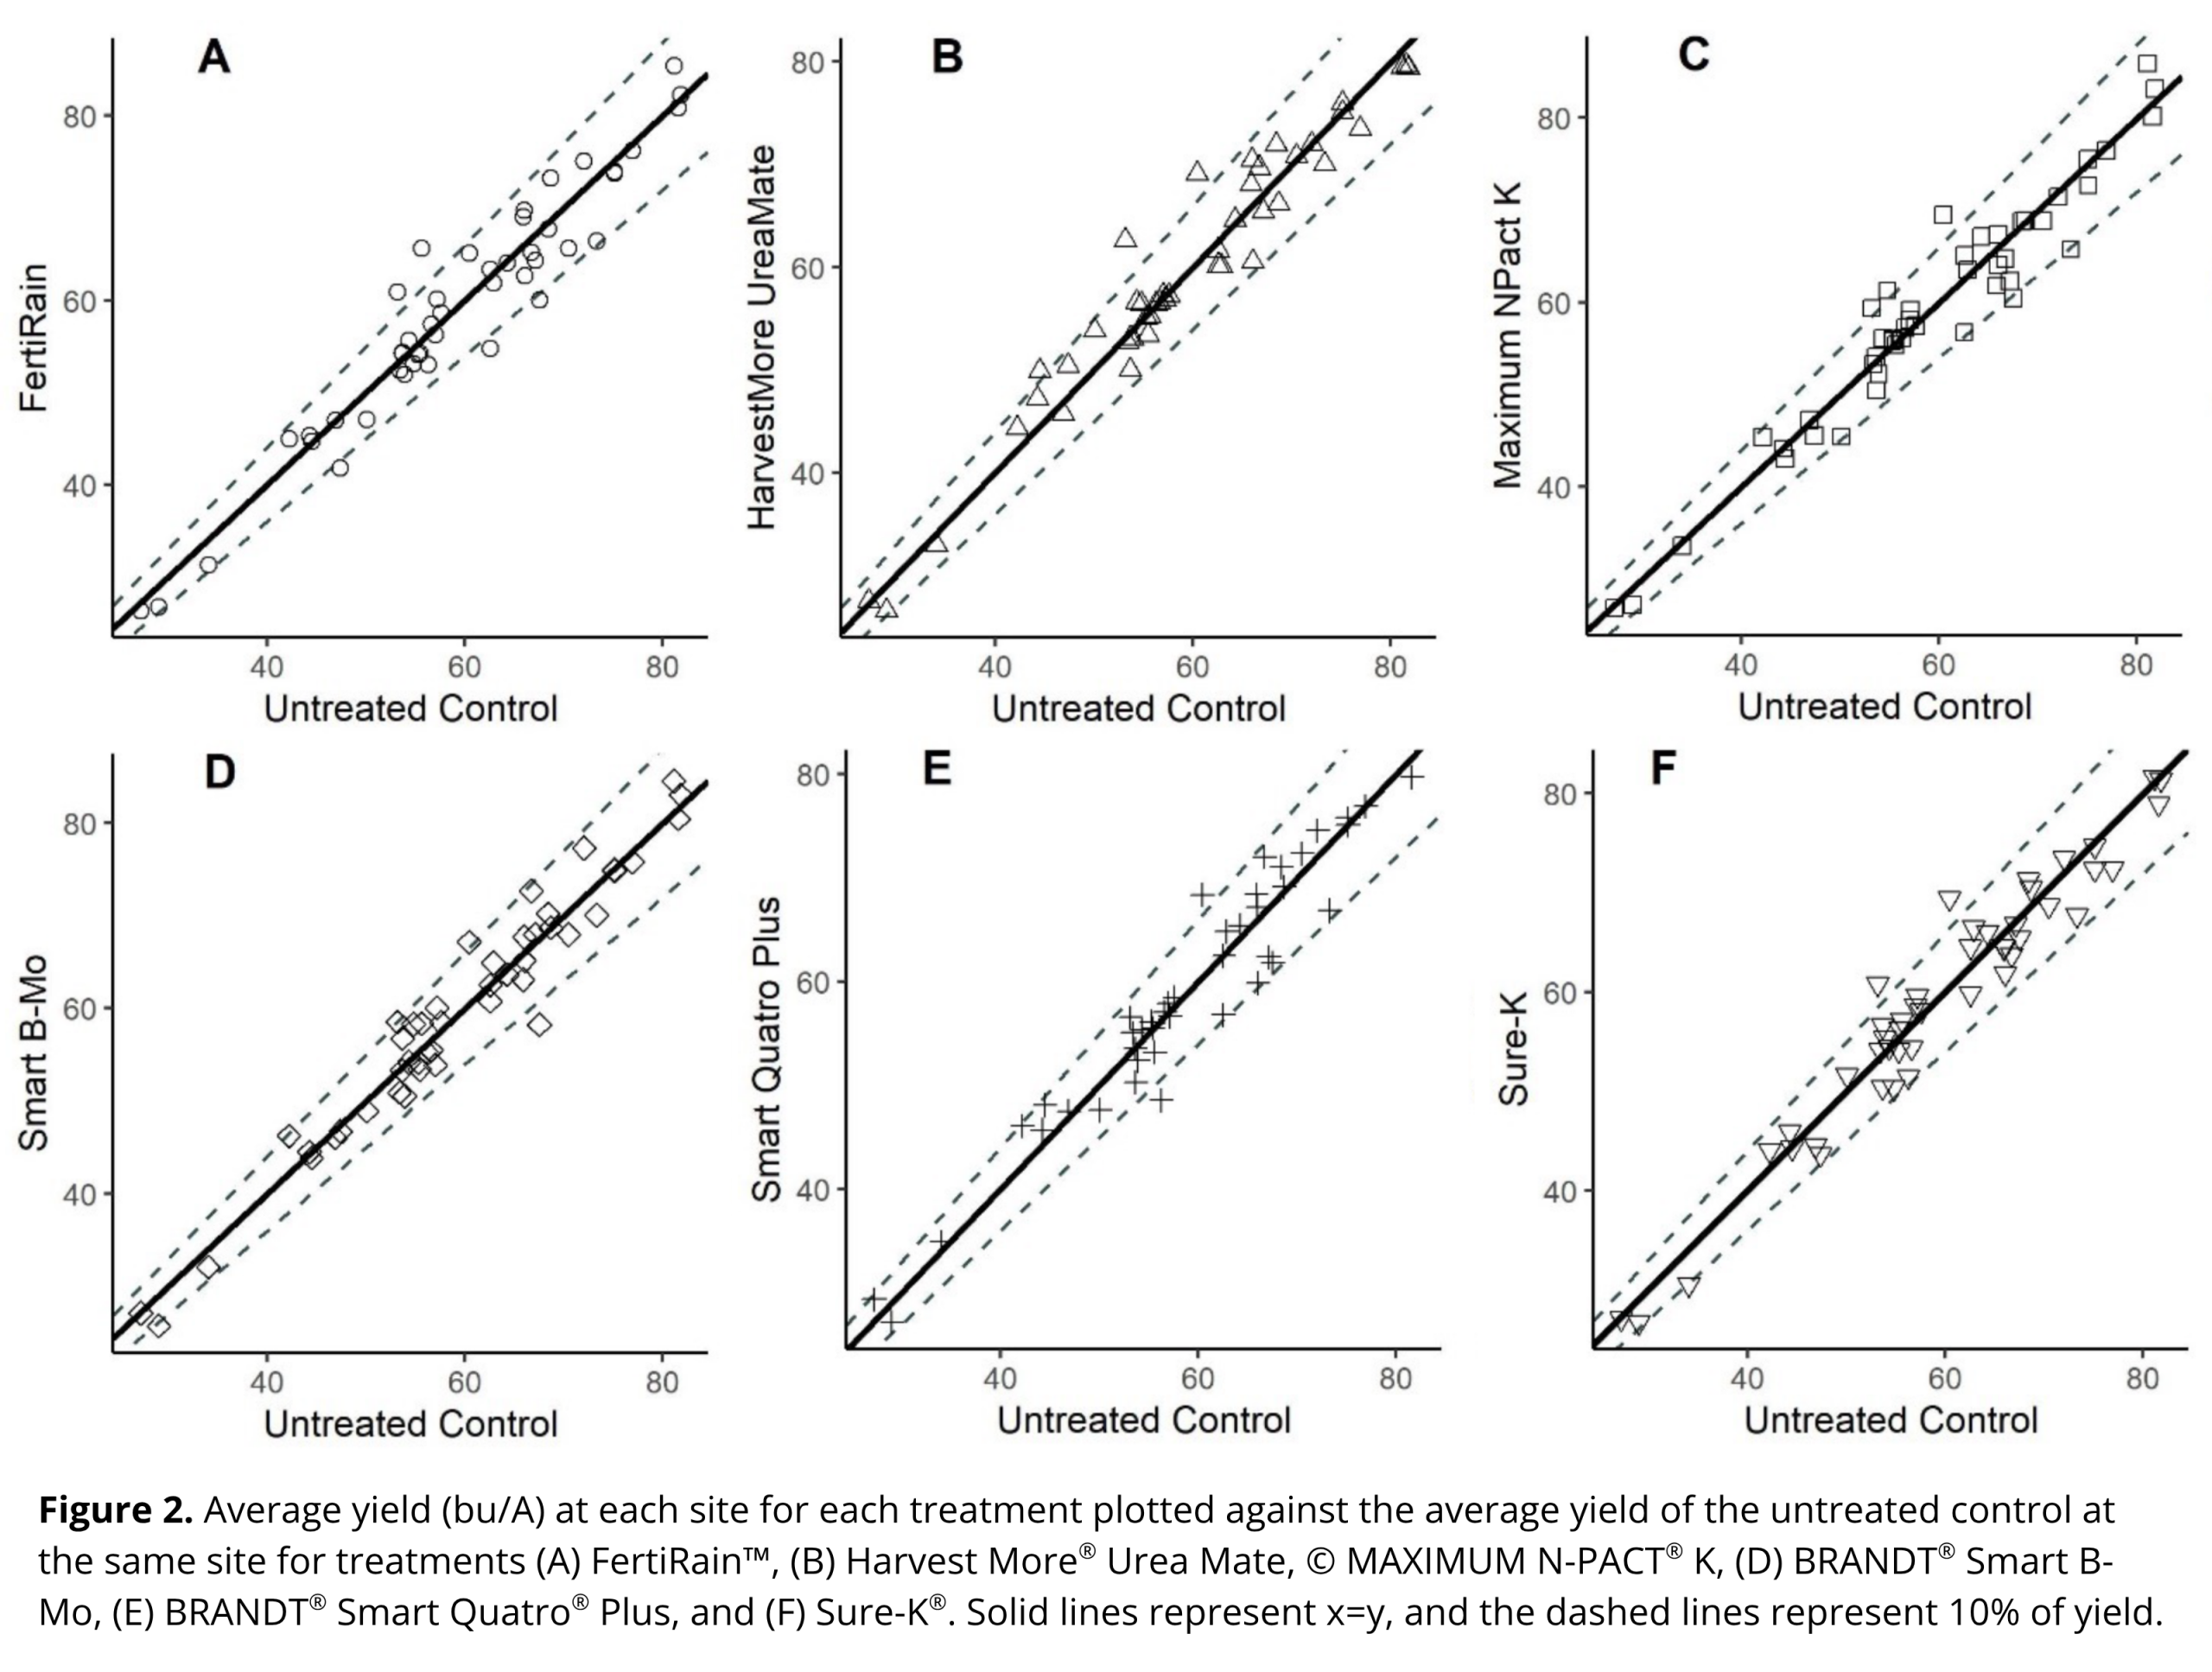
The treated plots and untreated control plots yielded similarly. Each subplot in Figure 2 compares yield in a fertilized treatment to yield in the untreated control. When points fall above the solid line, it indicates that the fertilized plots yielded higher than the untreated control plots at a particular site. Points falling below the solid line indicate a site where the untreated control plots yielded higher than the fertilized plot. When points are between the solid line and dashed line, the treated and untreated plots at that site yielded within 10% of each other. The few points that fell above the 10% yield increase line tended to have average yields near 60 bu/A. All sites with average yields higher than 80 bu/A had mean treated plot yield within 10% of the untreated control plots for all foliar fertilizer products (Figure 2). Observed differences in yield among treatments were not statistically significant (F=0.23, p=0.9663). There was not a significant interaction between site and treatment, which indicates that all products performed similarly across all sites.
Given the uniformity of the response across these 46 sites, there is no evidence that foliar fertilizers increase soybean yield in the absence of visual symptoms of nutrient deficiency. Similar results were observed in a smaller geographic area in past trials from Iowa and Michigan, where micronutrient and macronutrient foliar fertilization did not consistently increase soybean grain yield (Mallarino et al., 2001; Staton, 2019).
The sites tested in this trial included a wide range of soil chemical and physical properties (view Supplemental Table 1 in factsheet). When analyzed individually, four of the 46 site-years had significantly different yield between treatments, but there was not a discernable reason for those four sites to respond when 42 did not. Soil properties were not necessarily predictive of yield response. Sites such as Princeton, Kentucky (2020) and Fargo, North Dakota (2019), had soil test P concentration below 15 ppm, but did not have a yield response to treatment. Site soil pH ranged from 4.7 to 8.3, and generally sites with pH higher than 7.5 or 8 have lower micronutrient availability. All four responsive sites had soil pH between 6.5 and 7.3, and pH was not predictive of site responsiveness.
Average protein and oil content across all sites and treatments was 37.6% and 20.6%, respectively. Differences in grain protein and oil content were observed among sites but not treatments. At nutrient application rates currently recommended by foliar fertilizer manufacturers, there is no evidence that fields that receive foliar fertilizer should be expected to have different grain protein or oil content as compared to fields that do not receive foliar fertilizer.
Across all sites and treatments, average leaf tissue Ca, Mn, and B concentration increased slightly between the preapplication sampling and the two weeks after application timepoint. Leaf tissue S concentration did not change between sampling timepoints, and concentration of N, P, K, Mg, Fe, and Cu decreased by less than 10% between the pre-application sampling timepoint and the two weeks after application timepoint. This is likely due to soybean plants partitioning an increasing proportion of their nutrient uptake to seeds relative to other plant parts after R4 (Gaspar et al., 2017). Across all nutrients tested, there was a significant difference in leaf tissue nutrient content among sites. Leaf tissue Mn, Cu, and B content varied among treatments.
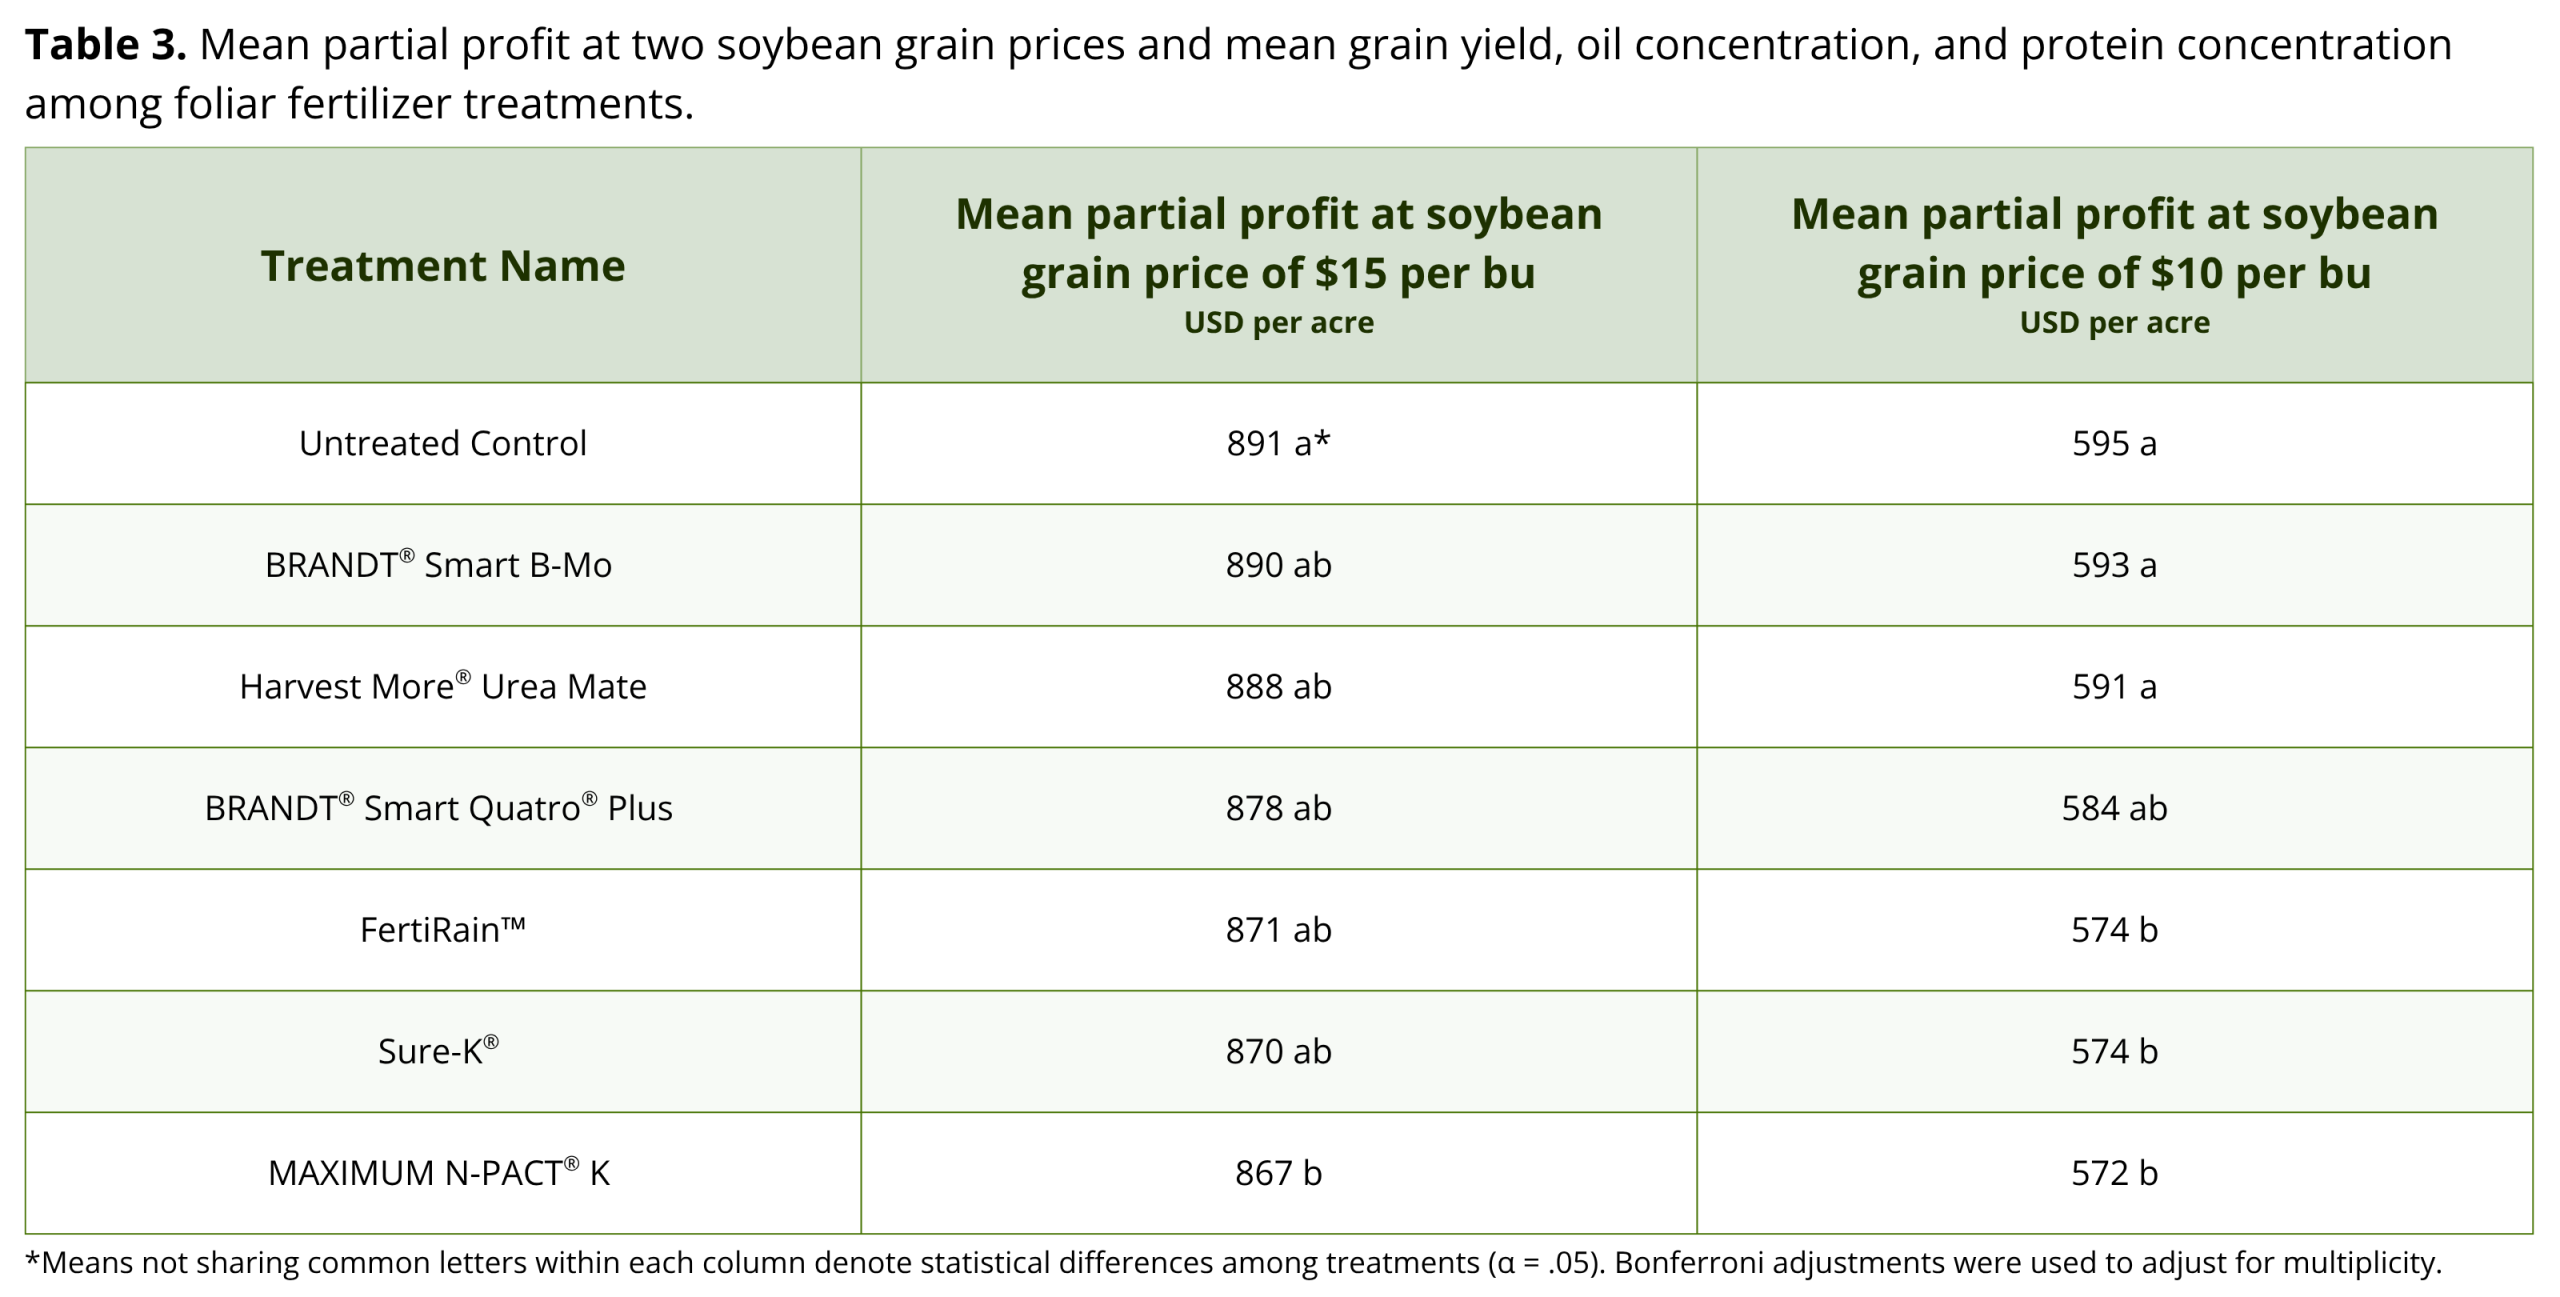
Cost of foliar fertilizer products ranged from $3.64 to $22.27 per acre. Partial profits were different among treatments and sites at both tested soybean grain prices ($10 and $15 per bushel), and there was no interaction between treatment and site at either tested soybean grain price. At $15 per bushel, plots treated with MAXIMUM N-PACT® K had $24 per acre lower profits than the untreated control and at $10 per bushel, plots treated with MAXIMUM N-PACT® K, Sure-K®, and FertiRain™ had lower profits than the untreated control by $23, $21 and $21 per acre, respectively (Table 3). While other treatments did not have statistically lower profits than the untreated control at the tested grain prices, application of foliar fertilizer products included in this study would not increase profit since foliar fertilizer treatments did not statistically increase soybean grain yield. Further reductions in profit may occur when applying foliar fertilizer using a ground-based applicator since wheel damage can reduce soybean yield by 3%-5% after R1 (Hanna et al., 2008).
Recommendations
Prophylactic foliar fertilizer applications did not consistently increase soybean yield or alter grain composition when applied at rates recommended by their manufacturer. Based on the results of this study and the current body of published agronomic research, there is no scientific evidence to support the use of foliar fertilizer products on soybeans in the absence of visual symptoms of nutrient deficiency.
Learn More
Further information on this trial, including individual site results, is available in the full publication at: https://doi.org/10.1002/agj2.20889.
References
Fagaria, N., Filho, M., Moreira, A., & Guimarães, C. M. (2009). Foliar fertilization of crop plants. Journal of Plant Nutrition. 32(6): 1044-1064.
Garcia L., R., & Hanway, J. J. (1976). Foliar fertilization of soybeans during the seed-filling period. Agronomy Journal. 68(4), 653–657. https://doi.org/10.2134/agronj1976.00021962006800040030x
Gaspar, A. P., Laboski, C. A. M., Naeve, S. L., & Conley, S. P. (2017). Phosphorus and potassium uptake, partitioning, and removal across a wide range of soybean seed yield levels. Crop Science. 57(4), 2193–2204. https://doi.org/10.2135/cropsci2016.05.0378
Hanna, S.O., Conley, S.P., Shaner, G.E. and Santini, J.B. (2008), Fungicide Application Timing and Row Spacing Effect on Soybean Canopy Penetration and Grain Yield. Agron. J., 100: 1488-1492. https://doi.org/10.2134/agronj2007.0135
Haq, M. U., & Mallarino, A. P. (1998). Foliar fertilization of soybean at early vegetative stages. Agronomy Journal, 90(6), 763–769. https://doi.org/10.2134/agronj1998.00021962009000060008x
Mallarino, A. P., Haq, M. U., Wittry, D., & Bermudez, M. (2001). Variation in soybean response to early season foliar fertilization among and within fields. Agronomy Journal. 93(6), 1220–1226. https://doi.org/10.2134/agronj2001.1220
Poole, W. D., Randall, G. W., & Ham, G. E. (1983). Foliar fertilization of soybeans. I. Effect of fertilizer sources, rates, and frequency of application. Agronomy Journal. 75(2), 195–200. https://doi.org/10.2134/agronj1983.00021962007500020010x
Sharma, S., Culman, S., Fulford, A., Lindsey, L., Alt, D., & Looker, G. (2018). Corn, soybean, and alfalfa yield responses to micronutrient fertilization in Ohio, AGF-519. Ohio State University Extension. https://ohioline.osu.edu/ factsheet/agf-519.
Staton, M. J. (2019). Foliar fertilizer applications to soybeans are rarely profitable. Michigan State University Extension. https://www.canr.msu.edu/news/foliar_fertilizer_applications_to_soybeans_are_rarely_profitable
Syverud, T. D., Walsh, L. M., Oplinger, E. S., & Kelling, K. A. (1980). Foliar fertilization of soybeans (Glycine max L.). Communications in Soil Science and Plant Analysis. 11(6), 637–651.
CO-AUTHORS
Emma G. Matcham, University of Wisconsin-Madison; Shawn P. Conley, University of Wisconsin-Madison; Laura E. Lindsey, The Ohio State University; Rachel A. Vann, North Carolina State University.
COLLABORATORS
David Lee Holshouser, Virginia Polytechnic Institute and State University; Matthew Inman, Clemson University; Trent Irby, Mississippi State University; Hans Kandel, North Dakota State University; Jonathan Kleinjan, South Dakota State University; Carrie Knott, University of Kentucky; Chad D. Lee, University of Kentucky; Josh Lofton, Oklahoma State University; David Mosley, Louisiana State University; Seth Naeve, University of Minnesota; Jeremy Ross, University of Arkansas System, Division of Agriculture; Maninder Singh, Michigan State University; William Wiebold, University of Missouri; David L. Wright, University of Florida.