Agronomic data reaches farmers through product advertisements, extension publications, and industry portfolios, among others. Being able to interpret complex data is necessary for assessing the validity of the information and using numbers to draw conclusions that ultimately lead to profitable management decisions.
Checklist
- Dataset originates from an acceptable study design
- Statistical parameters are reported
- Study accounts for known and unknown variability
Types of Variability
- Between-treatment variability: caused by differences between products or practices
- Random field variability: not caused by treatment effects, e.g., differences in soil properties

Terms to Know
- CV (coefficient of variation): a measurement of the overall experiment variability.
- Low CV = low overall experiment variability, or individual observations are close to the experiment average
- p-value (probability value): indicates the level of confidence that treatment differences are a result of between-treatment variability and not random field variability.
- p-value of 0.03 = 97% chance that the observations are due to between-treatment variability and not random field variability.
- Significance level: a threshold determined by the user to classify p-values as significant or not significant. The significance level of 0.05 (95% confidence) is a common benchmark in agronomic research although higher significance levels such as 0.10 (90% confidence) may be warranted in situations where lower confidence levels can be tolerated.
- p-value < significance level = the difference between treatments is significant.
Example 1: The Fertilizer Experiment

Example 1 Conclusion
Fert. X outyielded the Control by 3.5 bu/ac, and this difference was significant (at a significance level of 0.05), indicating that the yield gain was likely due to between-treatment variability (e.g. application of fertilizer).
Example 2: The Soybean Variety Experiment
Solely comparing average differences can be misleading
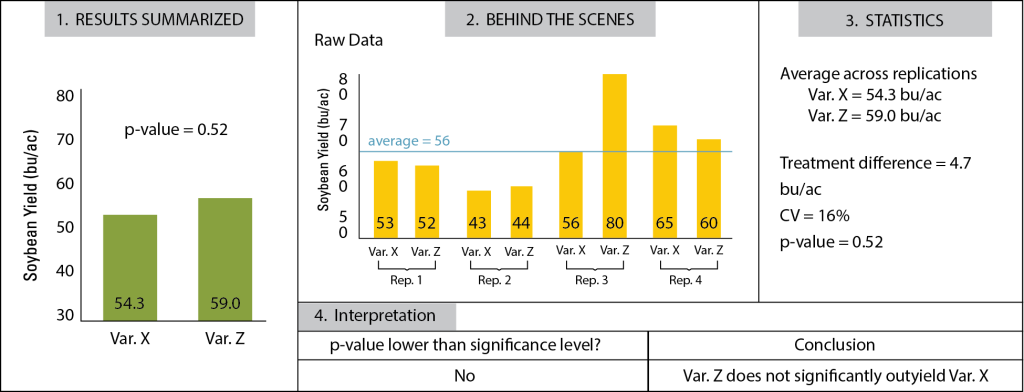
Example 2 Conclusion
Var. Z outyielded Var. X by 4.7 bu/ac. However, this difference was not significant (at a significance level of 0.05), and is likely the result of random field variability.
Key Takeaway:
A small but significant yield advantage (Ex. 1) is more meaningful than a larger but non-significant yield advantage (Ex. 2).
Authors: Daniela Carrijo, Penn State University; Nicole Fiorellino, University of Maryland; Mark Licht, University of Iowa; Emma Matcham, University of Florida; Manni Singh, Michigan State University.