Take Home Points
- Check your soybean seed tag for the warm germination test results before planting and adjust seeding rate accordingly.
- Seed germination may be lower than expected if the previous year had challenging harvest conditions.
Seed Viability Tests
Seed viability is one of the most important aspects of seed quality and is evaluated through a warm germination test. The warm germination test result is shown on the seed tag along with the testing date. The results of the warm germination test should be used to adjust seeding rates to ensure an adequate number of viable seeds per acre. It is particularly important to pay attention to germination tests following challenging harvest conditions in the previous year, such as delayed harvest due to wet weather.
Warm Germination Test
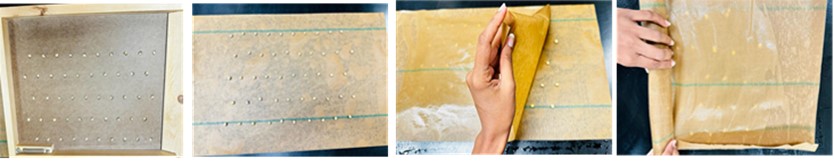
The warm germination test is used to evaluate seed viability under favorable conditions for seed germination. For this test, seeds are placed on moist germination paper, rolled up and enclosed in a plastic bag (Figure 1). These plastic bags with seeds are then incubated at 77°F in light for seven days. After the seven-day incubation period, the number of normal seedlings, abnormal seedlings, and dead seeds are counted (Figure 2).

Cold Germination & Accelerated Aging Tests
The cold germination and accelerated aging tests can be used to assess seed quality under a more stressful condition.
In the cold germination test, water is added to a plastic tray with an absorbent material placed on top of the water. Then, seeds are placed on top of the absorbent material and covered with soil. After the trays are prepared, they are placed inside a cold chamber held at 50°F for seven days before being moved to room temperature. After four days at room temperature, the number of normal seedlings, abnormal seedlings, and dead seeds are counted.
The accelerated aging test is conducted using plastic germination boxes with an elevated screen inside. Seeds are placed onto the screen with water added to the bottom of the box. The box is then covered with a lid. The boxes are placed into an accelerated aging chamber for 72 hours at 105°F and 100% humidity to facilitate the aging process. After 72 hours, the seeds undergo a standard warm germination test to quantify the number of normal seedlings, abnormal seedlings, and dead seeds.
Adjusting Your Seeding Rate
Before planting, make sure you check your seed tag for warm germination percentage. To calculate your seeding rate, divide your desired plant population per acre by the germination percentage (converted to decimal form).
For example, if your desired plant population is 120,000 plants per acre and the germination percentage on the seed tag is 85%, divide 120,000 by 0.85. To achieve a plant population of 120,000 plants per acre, you will need to seed at least 141,000 seeds per acre. Keep in mind, not all ‘live’ seeds will survive and produce a plant due to abiotic and biotic stressors during the growing season, so further seeding rate adjustments may be needed depending on your specific field conditions and environment. Table 1 gives soybean seeding rates to achieve the desired soybean plant population based on the germination percentage.

| Seeding Rate (seeds/acre) | |||||
|---|---|---|---|---|---|
| Desired Soybean Plant Population (plants/acre) | |||||
| % Germination | 100,000 | 120,000 | 140,000 | 160,000 | 180,000 |
| 70 | 143,000 | 171,000 | 200,000 | 229,000 | 257,000 |
| 75 | 133,000 | 160,000 | 187,000 | 213,000 | 240,000 |
| 80 | 125,000 | 150,000 | 175,000 | 200,000 | 225,000 |
| 85 | 118,000 | 141,000 | 165,000 | 188,000 | 212,000 |
| 90 | 111,000 | 133,000 | 155,000 | 178,000 | 200,000 |
| 95 | 105,000 | 126,000 | 147,000 | 168,000 | 189,000 |
For information on identifying the ideal plant population density for your region, read our factsheet on Soybean Plant Population Density at https://resources.ipmcenters.org/resource.cfm?rid=45260&vid=30379.
You can also check out the management guide published in the Crop, Forage, and Turfgrass Management journal at https://doi.org/10.1002/cft2.70118.
Authors: Prabath Senanayaka Mudiyanselage and Laura Lindsey, The Ohio State University