Yield maps made using yield monitor data are very good at visually displaying relative yield differences in a field, but extra care must be taken if you want to use yield monitor data to estimate field average yields.
Key Takeaways
- Most yield monitors on combines use impact sensors to estimate yield.
- Each observation on a yield map requires information about the force of grain on the impact sensor, the location of the combine, the length of time it took the grain to move from the cutter bar to the clean grain elevator, and the width of the combine pass.
- Yield map data quality can be improved by calibrating the yield monitor, keeping a consistent combine pass width, and operating your combine at a speed similar to the speed used for calibration.
Combine Basics
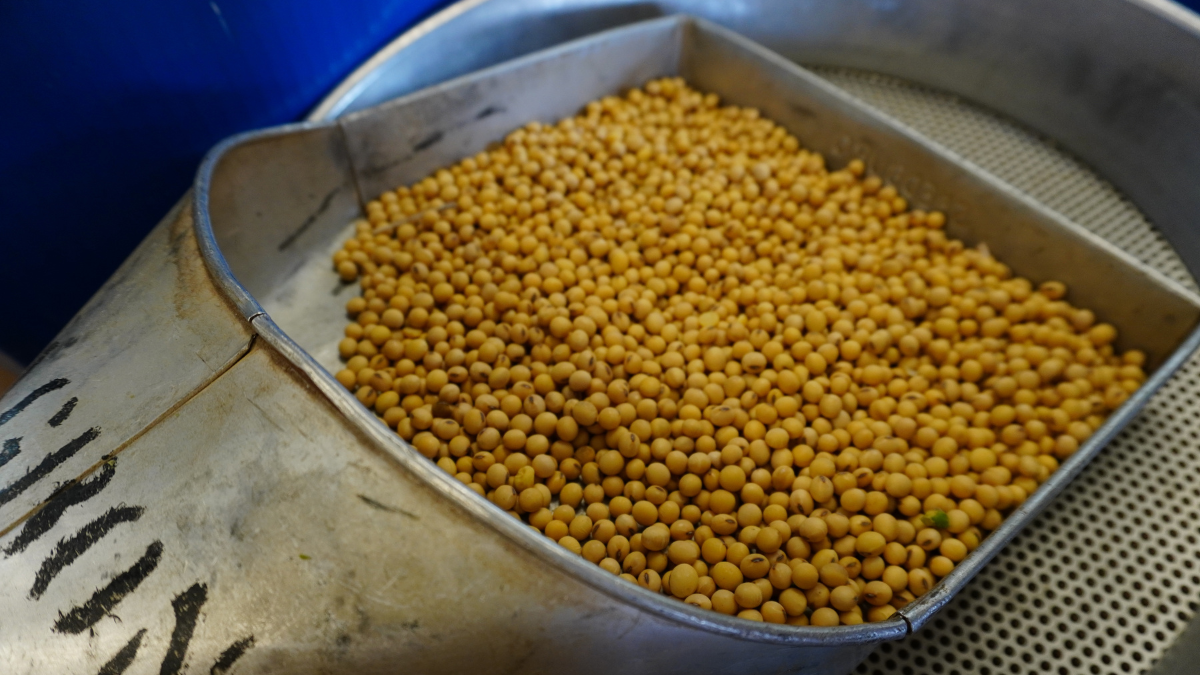
- Combines are used to harvest grain.
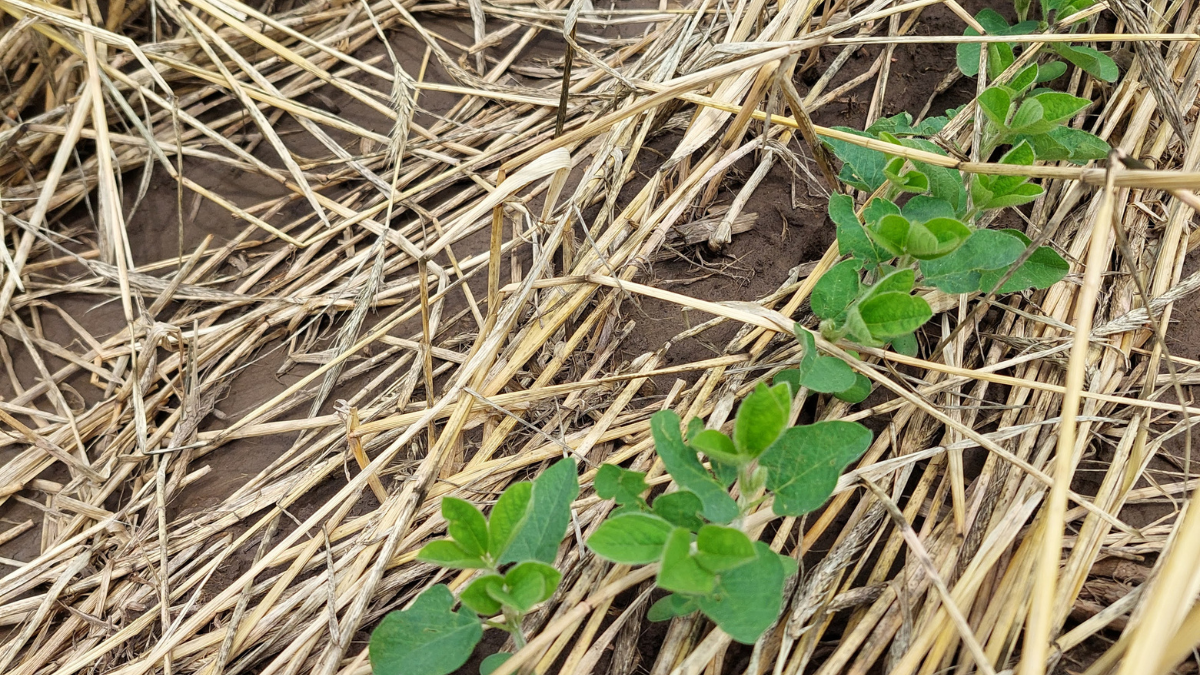
- Plant material is cut from the ground, and then fed into the combine by a series of belts and reels. The grain is then separated from the rest of the plant material.
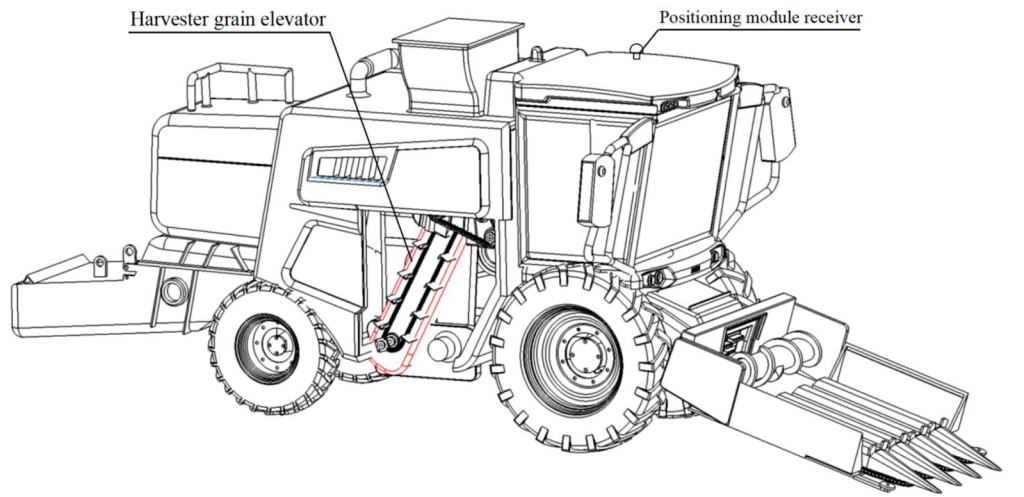
- Grain moves into the holding tank/hopper of the combine via the clean grain elevator.
- Most yield monitors in the US measure the force of grain as it hits an impact sensor as it moves from the clean grain elevator into the hopper. But, there are other types of yield monitors that weigh subsamples or use optical or nuclear sensors.
Yield Monitor Basics
Making yield maps from yield monitor data:
- Measurements from impact sensors are combined with information about the width of the combine pass to estimate yield for a particular yield map observation.
- Each estimate of yield is placed on the map using information about the location of the combine at the time the impact sensor measurement was recorded, plus information about how long it took for grain to move from the cutter bar to the clean grain elevator. This time estimate is frequently called the “flow delay.”
Flow Delay: Time it takes for grain to move from the cutter bar to the clean grain elevator
Best Practices: Combine Operation for Data Quality
- Calibration
- Before harvest, calibrate the yield monitor using the manufacturer’s specifications.
- Consistent Width
- Combine operators can improve data quality during harvest by keeping a consistent swath width/ use their full header width for every pass. Having your passes 4 inches narrower than your full header width can result in 1-2% error in your final yield estimates.
- Keep Header Up When Possible
- Keep the combine header up when turning, and whenever the combine is moving but not harvesting plants. Having the header down while the combine moves can increase the number of “zero yield” observations on your final map.
- Maintain Speed within Calibration Range
- Some combines operate best when crop volume is kept constant throughout the whole field, which will require adjusting your ground speed throughout harvest. It’s best to calibrate your combine at a range of ground speeds, and then operate your combine at speeds within that range.
Best Practices: Data Processing
While calibrating your yield monitor is the most important step to having high quality yield data at the end of the season, there are some things you can check in post-processing to improve map quality.
Visually inspect your yield map, paying close attention to where the combine passes meet the end rows. If the combine passes start unevenly, you might need to adjust the flow delay settings (see example map).
Other post-processing steps, sometimes called data cleaning, vary by user. For research plots, we typically remove observations that fall within 2x the header width of your field border to reduce the edge effects. Other common filters for researchers include removing observations where yield or speed are outside of 3 standard deviations of the field average.
Example: Adjusting the Flow Delay
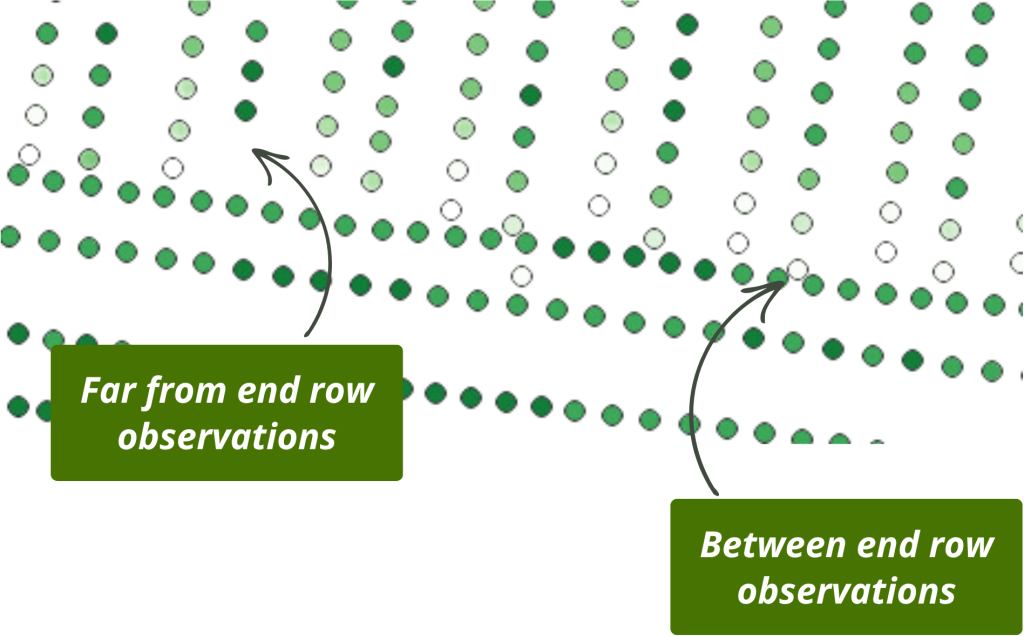
Notice how in this map, some points fall between the rows of end row observations and other combine passes start pretty far away from the end row? This is an indication that the flow delay needs to be adjusted.
Author: Emma Matcham.
References
*Cheng et al. (2023). Design and Experiment of Real-Time Grain Yield Monitoring System for Corn Kernel Harvester. Agriculture, 13(2), 294; https://doi.org/10.3390/agriculture13020294